.png)

Understanding the Value of Information
In recent posts, we’ve talked about the importance of probabilistic thinking and how it can help us express the uncertainty in our decision context. It’s also a very tangible way to demonstrate that we are acknowledging uncertainty, which is a core principle for The Uncertainty Project.
But what happens after we acknowledge the uncertainty?
In some respects, it will feel like we’ve just muddied the waters and made things more complex. Isn’t it simpler to just make decisions by leaning on a bunch of assumptions? Isn’t it easier to communicate our intent when we just assume that our actions will result in some improvement? Talking about hypotheses feels like we’re in a research lab; maybe we just want to get sh*t done by executing.
It would help if there was a way forward, after we make the uncertainty visible, that could help us:
- Justify discovery, experimentation, and learning, in support of our decisions
- Fight (or at least counter-balance) the status quo bias
- Leverage our natural aversion to loss, to amplify learning and make better decisions
In this post, we’ll introduce Douglas Hubbard’s concept of the “Value of Information”. It’s a subset of a method he calls Applied Information Economics in the book “How To Measure Anything”. We’ll explore it in the context of strategic investment decision making.
The approach:
- Introduce a way to explore uncertainty in the forecasts of metric trends (e.g. in a North Star Metric)
- Assess probabilities of hitting our desired targets, if we “do nothing”
- Frame a decision for a possible strategic investment
- Quantify the value of information that would support this decision making
- Use this understanding to pursue discovery efforts, research, experimentation, or small bets
This helps us put an economic model around the concept of “buying information”. More importantly, it can keep us from over- or under-spending on this information, once we know the value.
But what do we mean by information here?
Hubbard defines it very specifically, connecting information with uncertainty, decisions, and economics:
Information reduces uncertainty about decisions that have economic consequences.
The aim is to better understand the value of information, in the context of a specific decision, so that we can go “shopping for information” on a fixed budget.
Let’s start with something like a North Star Metric, that we use to measure success, set goals, and/or assess performance.
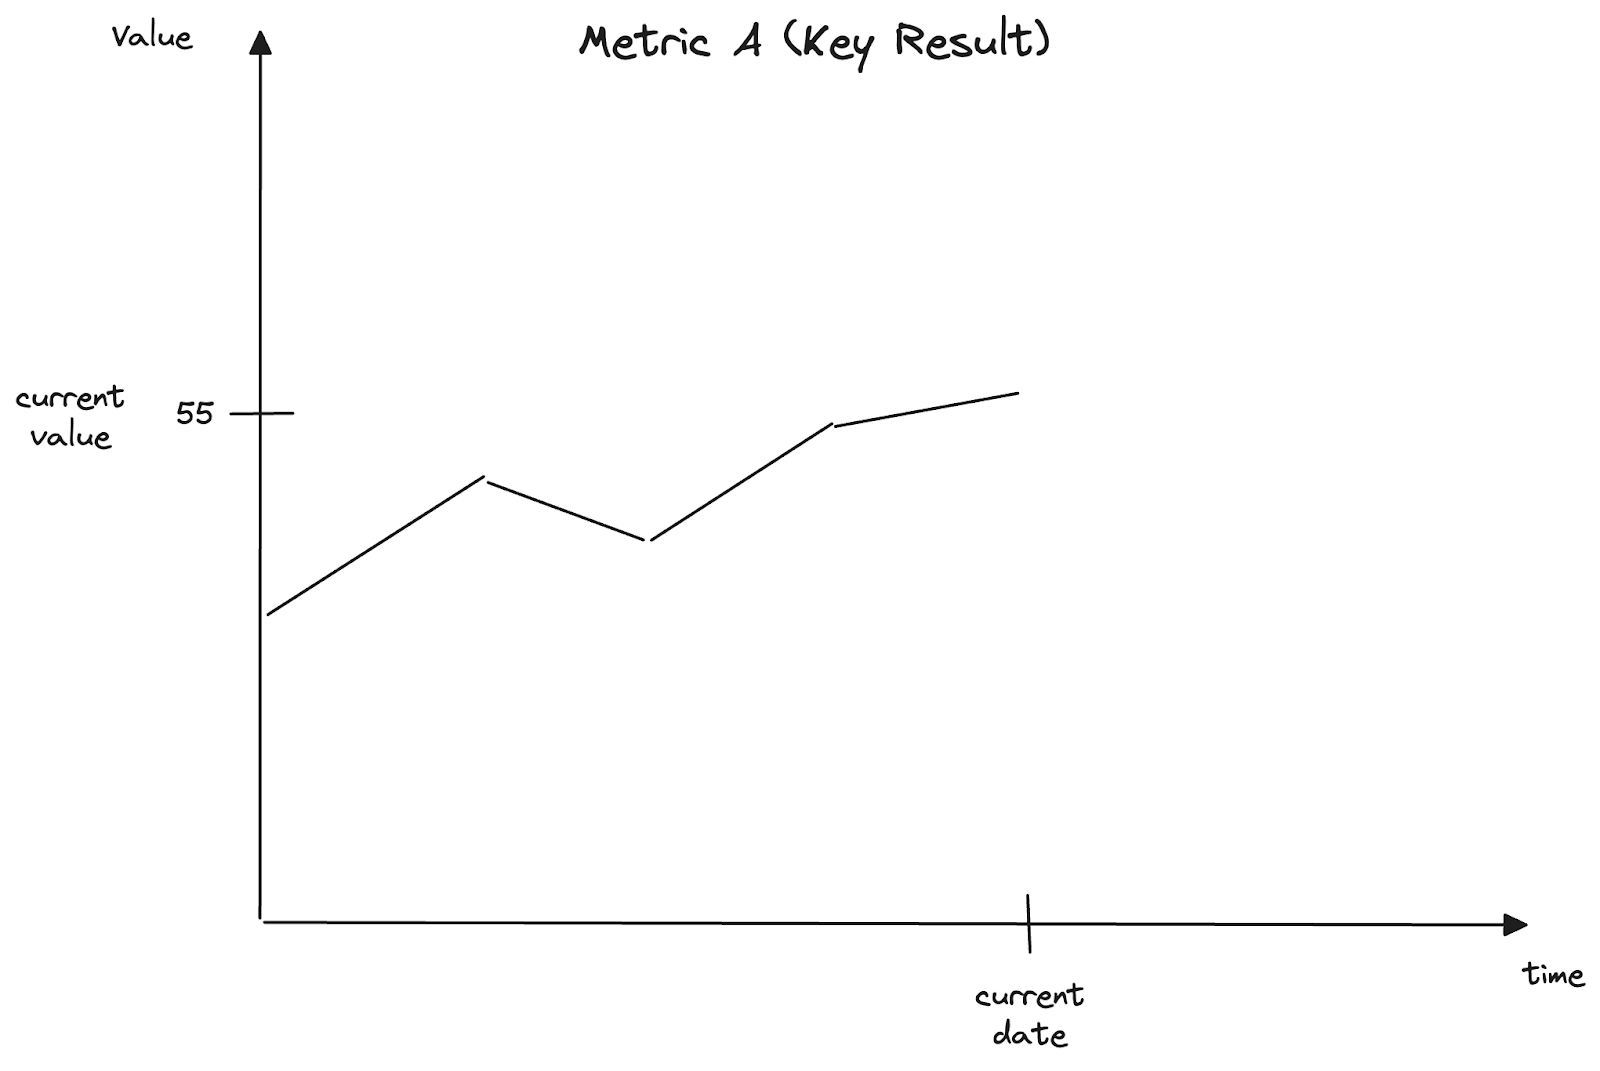
We track this measurement over time, and seek to influence where it goes in the future.
We have a plan of record (that we are already executing), and are already influencing this measurement, based on our current level of capability.
But is this status quo good enough?
That is, is it good enough to drive the metric to the levels we desire?
We should start exploring this question with an acknowledgement of the uncertainty in the context, recognizing that while some things here are under our control, it’s likely that there are other factors that are not.
When we set targets or goals, we make them time-bound by choosing a date in the future. But before we start this goal-setting process, we should understand the uncertainty in our current vision of this future.
To do this, Hubbard recommends soliciting experts for their assessment of a 90% confidence interval for the value, on the target date. But these experts are first qualified for the exercise, by “calibrating” them, like you would a measurement instrument. The calibration activity reveals the bias (either over-confidence or under-confidence) in their assessments of 90% confidence intervals over a series of representative examples (like a Noise Audit).
Why is “calibration” so important? Because our experts are usually overconfident.
“Organizations are sense-making machines and struggle to sustain legitimacy and respect if they admit their uncertainty. They give the appearance of order, and for long periods they provide the reality of order. But (in Daniel Kahneman’s words), ‘we are prone to overestimate how much we understand about the world and to underestimate the role of chance in events.’ So organizations often reward and promote the overconfident who reinforce the legitimacy of the organization – but precisely for that reason they are more prone to error unless mitigating processes are put in place to test, challenge and interrogate the overconfident. There is interesting research showing that senior people are not particularly bad at making predictions – but their confidence intervals are far too narrow, a symptom of overconfidence.”
Geoff Mulgan, “A theory of collective stupidity: laziness, likes and lemmings”
These experts will consider both those factors under the organization’s control, and those factors that are not. They will ask “How does this specific trend-over-time fit into a narrative about broader trends?”, like:
- Product life-cycles - is my product in a growth stage, or now mature?
- Business life-cycles - is this business still mature, or approaching its sunset?
- Category waves - is our recent growth due to our actions, or riding a wave?
- Macroeconomic conditions - do we sense an imminent downturn?
- Customer preferences/trends - are customer preferences changing in younger buyers?
- Technology trends - will this new technology erode our unique advantage?
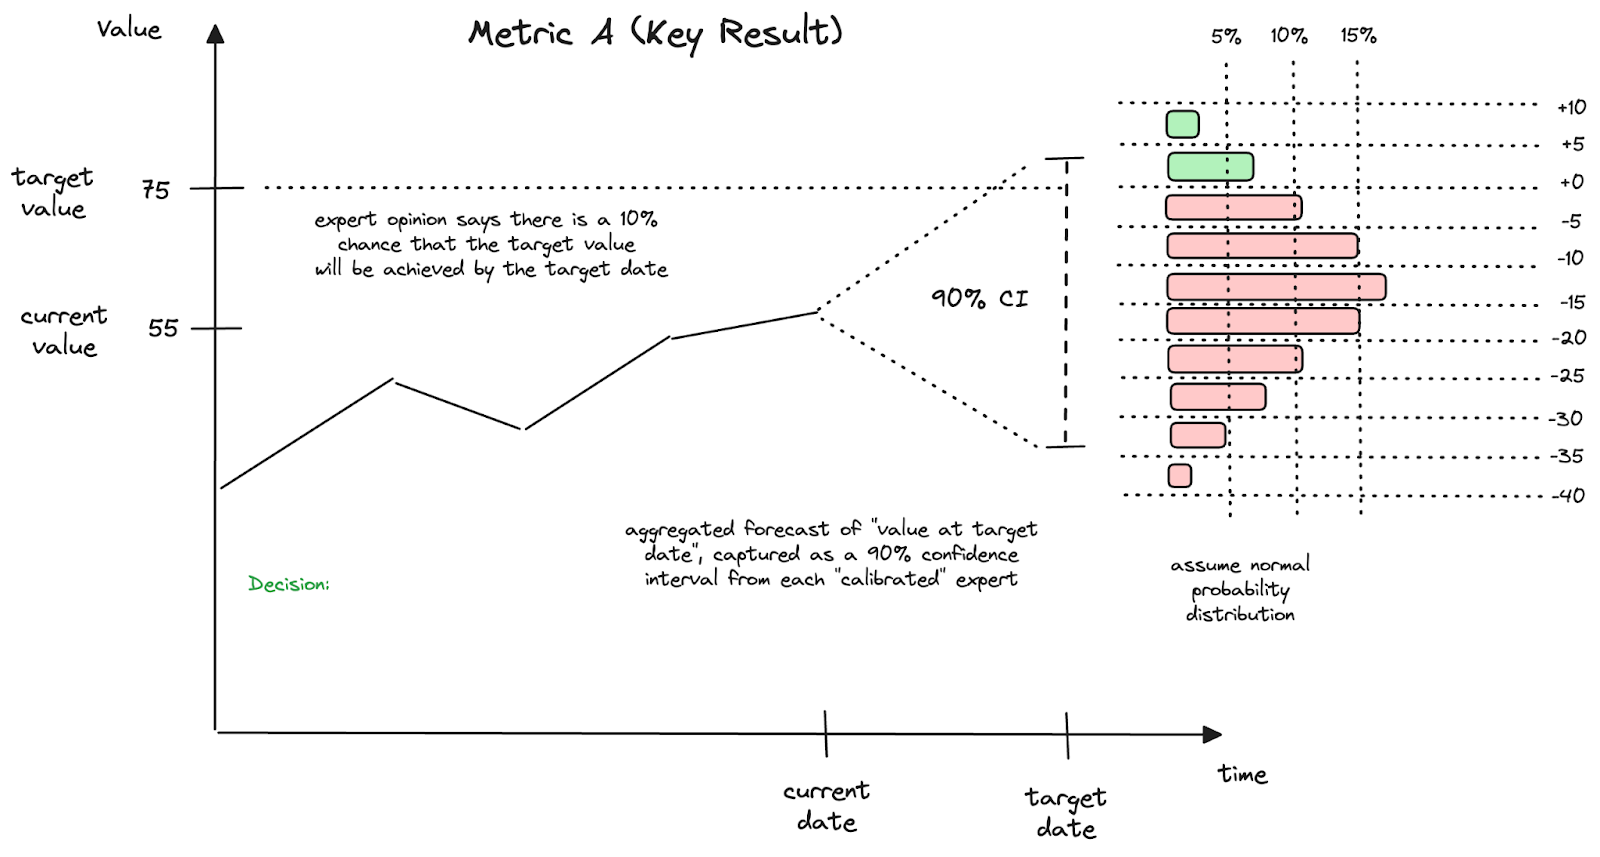
Each expert will provide an upper bound and a lower bound, such that they would stake their reputation that the actual result will fall between those bounds, across 90% of the “possible futures”. They should also provide some commentary or rationale on those bounds that illuminate their thinking.
Then, we can aggregate and average the answers to produce a single range:
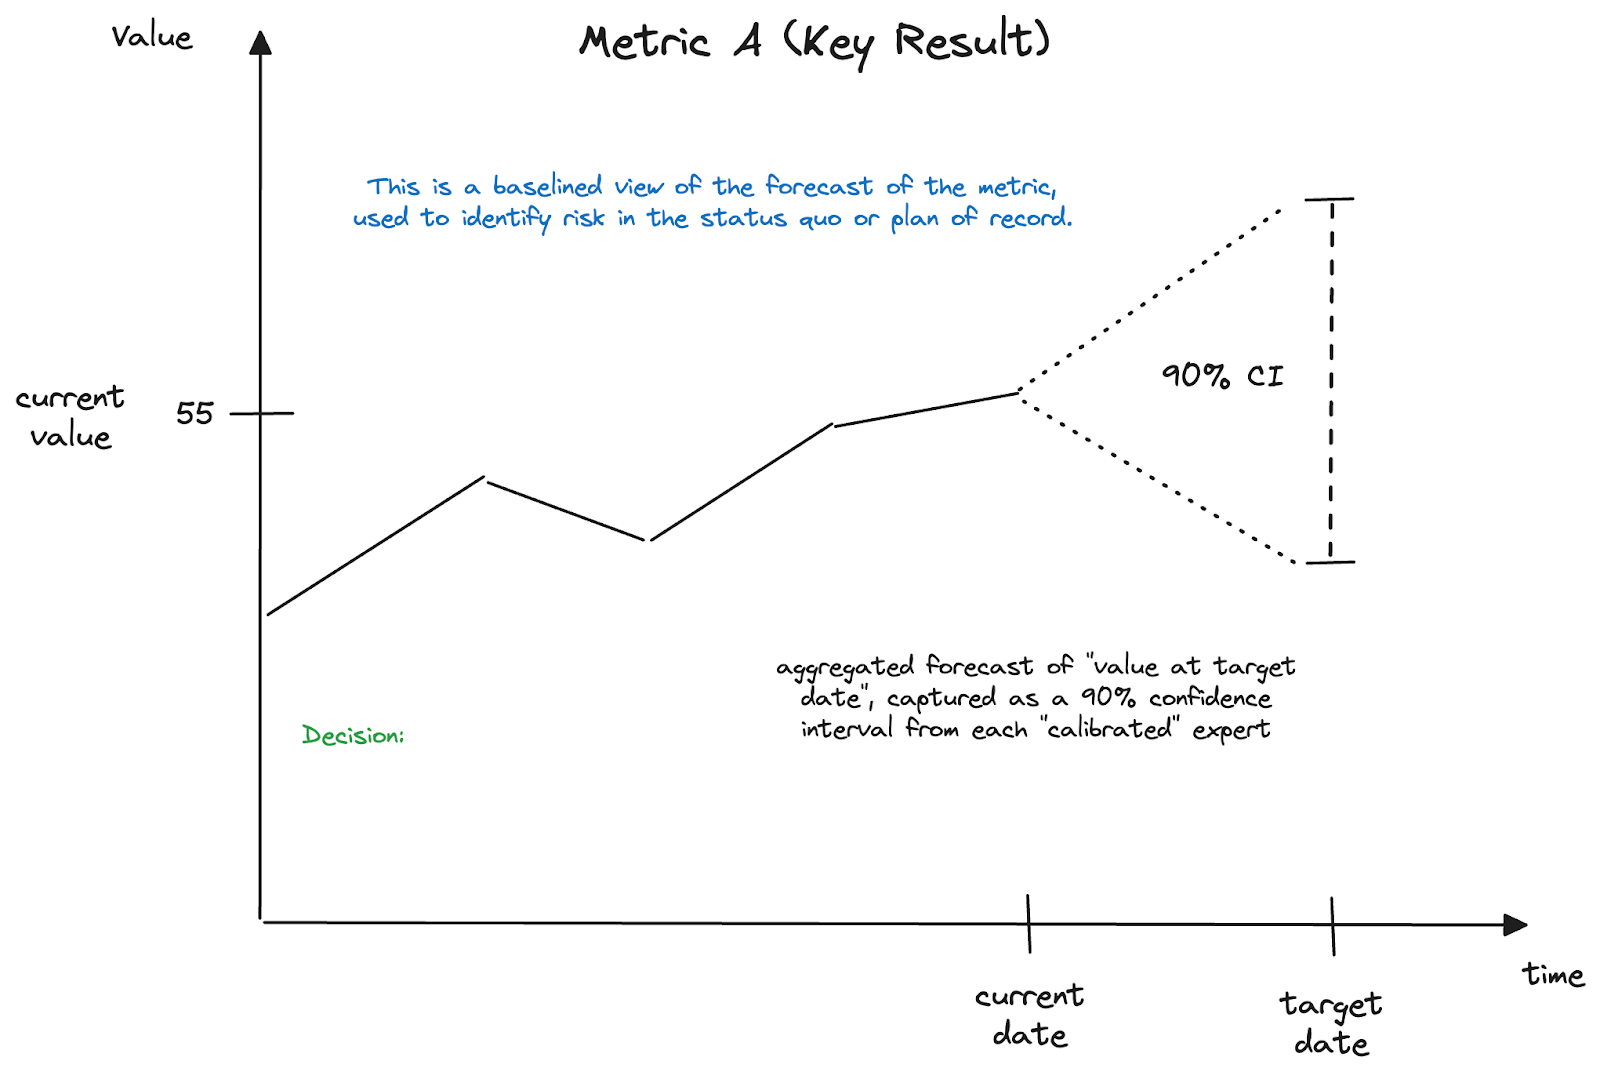
This range captures the uncertainty felt by the experts in the current context.
With this view, leaders can consider two questions:
- “Is the magnitude of the range (expected value) acceptable?”
- “Is the spread of the range (total uncertainty) acceptable?”
Crucially, this captures their view for the potential of the status quo - what’s possible with the current performance capabilities of the organization. It’s a baseline that we can use to launch conversations about driving strategic change (which, in theory, would shift the position of the 90% CI range).
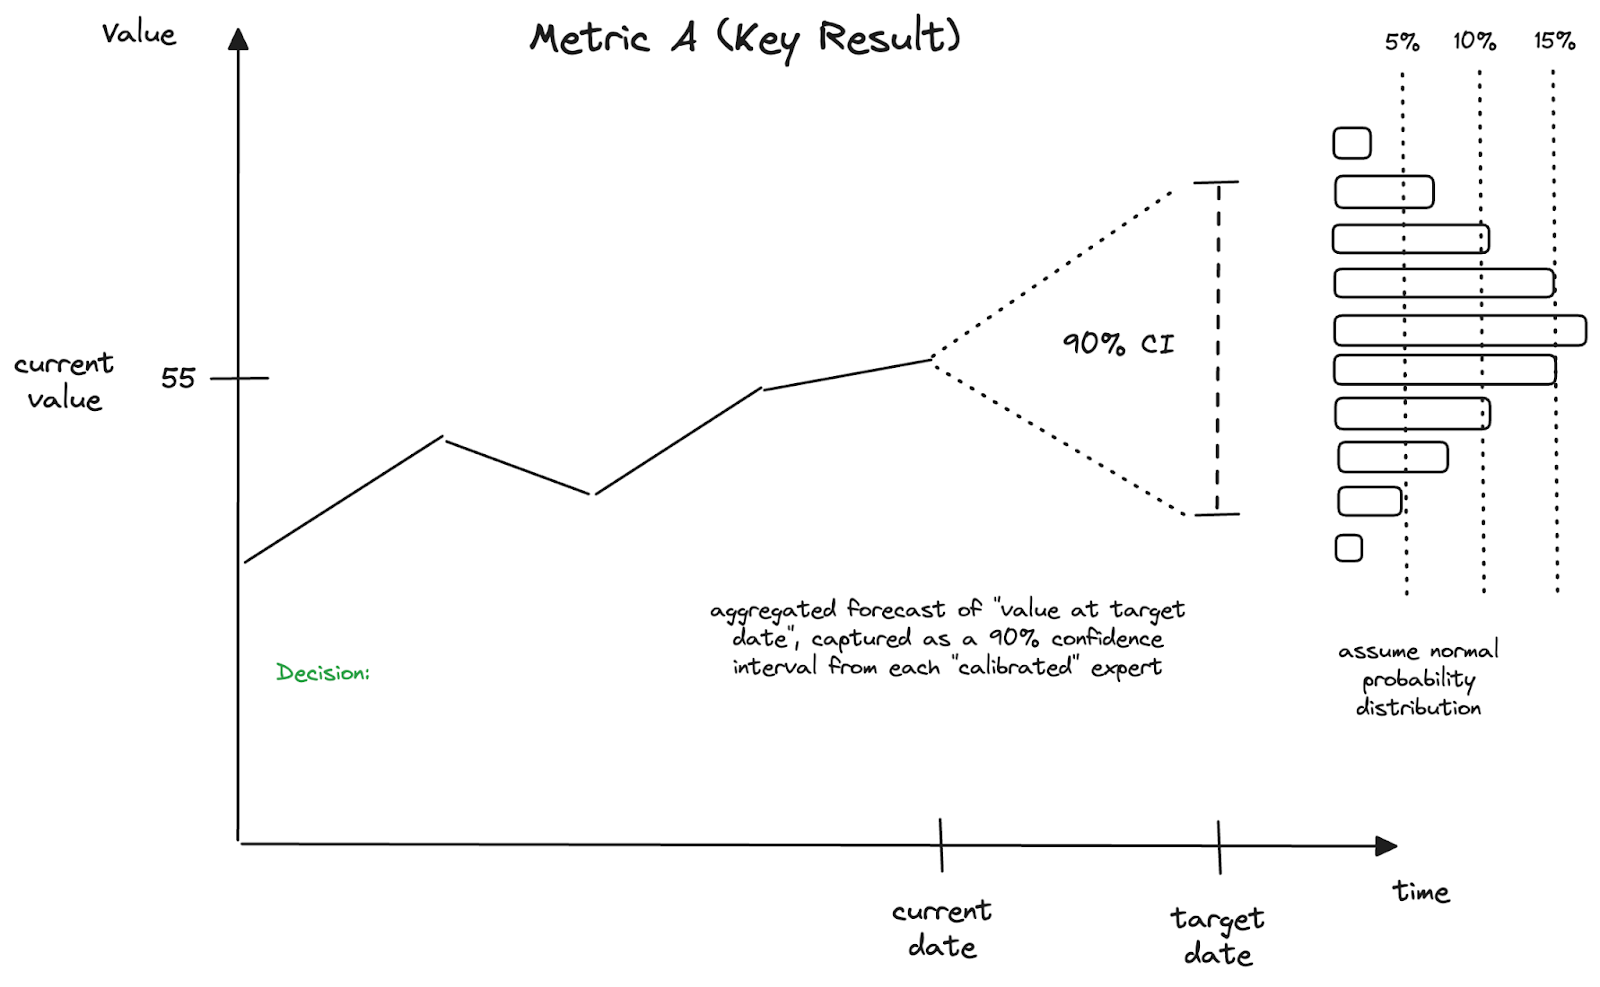
With this assessment, we can better assess organizational risks as we establish our vision and define success, and set new targets or goals that reference this metric.
Why better? Because we’ve opened a door to thinking probabilistically about our future. If we assume a normal probabilistic distribution across the CI range (which won’t always be ideal, but is a good place to start), then we see that while any number of futures are possible, some are more probable (according to our experts).
So now let’s propose a goal, or target level, for this metric.
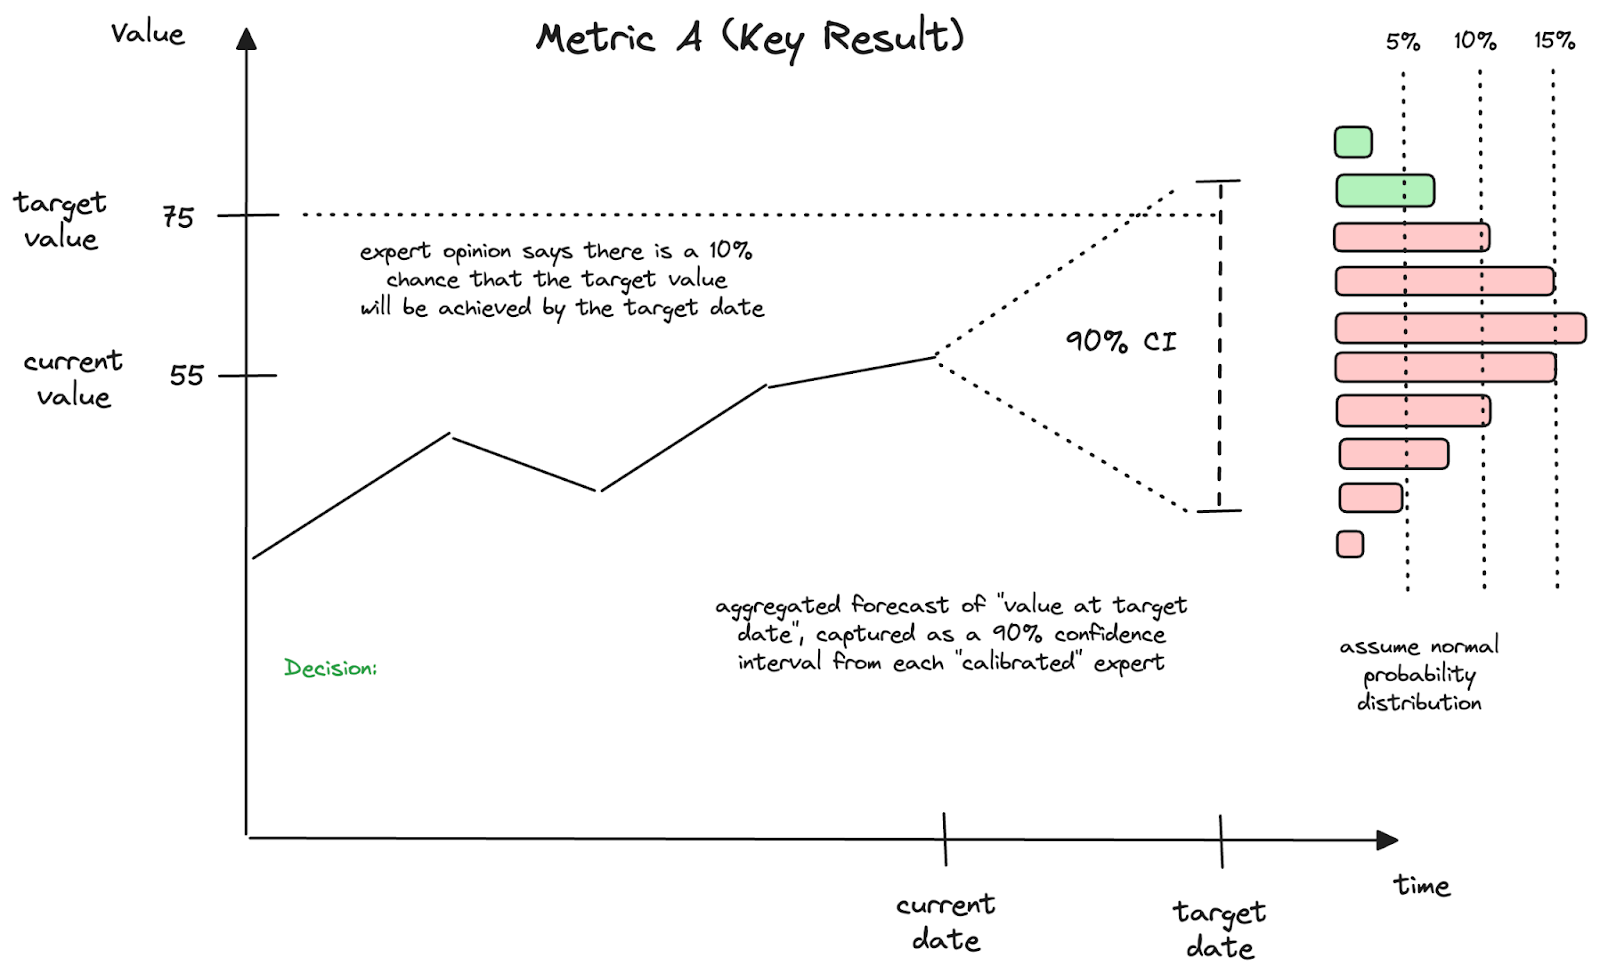
What are our chances of hitting this target, if we “do nothing”, organizationally speaking?
With this view, leaders can ask the big question:
- “Is relying on the status quo likely to get us to our target?”
Well, the expert opinions suggest that while it is still possible, it’s not probable. In fact, we can use the distribution overlay on the 90% confidence interval to put our chances at about 10%.
This should spark some strategic discussions.
For any strategic decision, we will want to compare this “do-nothing” option with options of various strategic investment paths. This view offers a richer understanding of the “do nothing” case.
But how deep is this understanding? Is it worth trying to learn more, before digging into possible strategic options?
This is where we want to revisit Hubbard’s definition of information:
“Information reduces uncertainty about decisions that have economic consequences.”
So let’s check where we are on these pieces:
- We’ve framed a decision, as we consider driving a strategic investment to break away from the status quo.
- We’ve defined a North Star metric to help define success, which implies that it reveals economic consequences (either directly or indirectly)
- We’ve exposed the uncertainty with our 90% confidence interval at the target date.
- We’re ready to seek information that might narrow the range in our 90% CI.
Any information that will do this (i.e. if we capture this information as an insight, and provide it to our experts before conducting another round of forecasting), has value to us.
But how much value? Can we quantify it? In economic terms?
Yes. Hubbard shows us how.
Let’s make a critical assumption here. [And I’m going to stray slightly from Hubbard’s portfolio management-based examples, which focus on break-even thresholds or payback periods on investment decisions…]
Let’s assume that we set a target value to “define success”, such that any value below that target is considered a “loss” to us. Since we’ve chosen the metric (“It’s our North Star!”) to help expose the economic consequences of our actions and decisions, we should be able to model the economic impact of a difference on the y-axis.
We want to get a relative change in the metric’s value (e.g. increase by 2) into dollar terms. In some cases, the metric might already be in dollars, but the leading metrics we prefer are often in different units.
This will require a simple economic model. Hubbard shows examples of how to do this, with a decomposition of the metric into other variables, and Fermi estimates of those variables.
The idea is to craft a “loss function” that expresses what the change in the metric’s value is worth to us. If all outcomes “in the red” are viewed as losses, we can calculate the expected loss of our status quo situation, given:
- The (assumption of a) normal distribution of our probabilities around the 90% CI estimates
- The relative magnitude at each of these values in the range
- The loss function that converts the magnitude (at that point) into dollars
With this, we can calculate the Expected Opportunity Loss (EOL) for the status quo. For each red segment, we multiply the chance of being wrong by the cost of being wrong, then add them all up.
Hubbard adds,
“Remember, EOL exists because you are uncertain about the possibility of negative consequences of your decision. If you could reduce the uncertainty, the EOL would be reduced.”
And as humans, we really don’t like to lose. We have a natural aversion to loss that is irrational in its scope. When we are evaluating the Expected Opportunity Loss for a metric or variable that informs a decision, we can use Loss Aversion to our advantage. When we see the stakes of the decision, expressed as EOL, then we should channel that discomfort into seeking information, to help us reduce the uncertainty, and work to reduce the expected opportunity loss!
So before discussing any options for strategic change, we should seek high-value information that could reduce the uncertainty (the spread in the 90% CI range), and therefore, reduce the EOL, for the status quo.
When our experts provided the range, they probably told us some specifics about why they lack confidence in their forecast. We can pursue (“buy”) information to address that, and confirm that the cost will be justified (i.e. if it is a fraction of the overall EOL). [Getting started, Hubbard recommends limiting your spending on information like this to <10% of your EOL.]
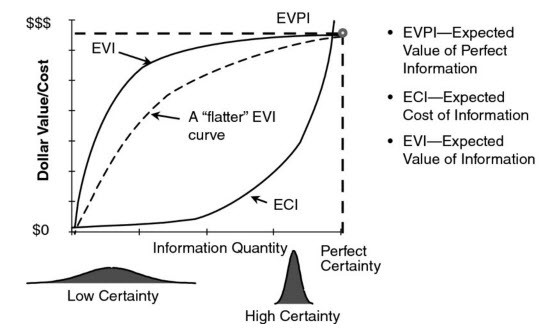
This illustrates Hubbard’s definition of the Value of Information:
Expected Value of Information (EVI) = EOL (before info) - EOL (after info)
So maybe you do a little research, get some fresh insights, and revisit those forecasts. Information that shrinks the spread in the 90% CI range is generally worth buying - it has value (especially the first, small “purchases”). Regardless, you’ll end up with a richer baseline for your strategic discussions.
And this same approach can be applied in those subsequent strategy discussions - around the decision of whether to make a strategic investment.
Let’s say that your stakeholders looked at that 10% chance of hitting the target and decided that the status quo just isn’t gonna cut it. They’ve got budget to drive change, and they want to spend it, dammit.
So a team assembles to explore ideas for change, building hypotheses around how specific actions might yield specific outcomes that will be visible with this metric (and drive it toward the target level).
They get excited about one or more of these high-level strategic directions, consider the needed level of investment, and frame it as a decision-to-make.
Now, we’ve got another chance to explore the value of information that could support this decision. But first, we need to capture our view of the alternate future - the one described by the hypothesis. Let’s bring in the experts, and ask them what they think about this hypothesis.
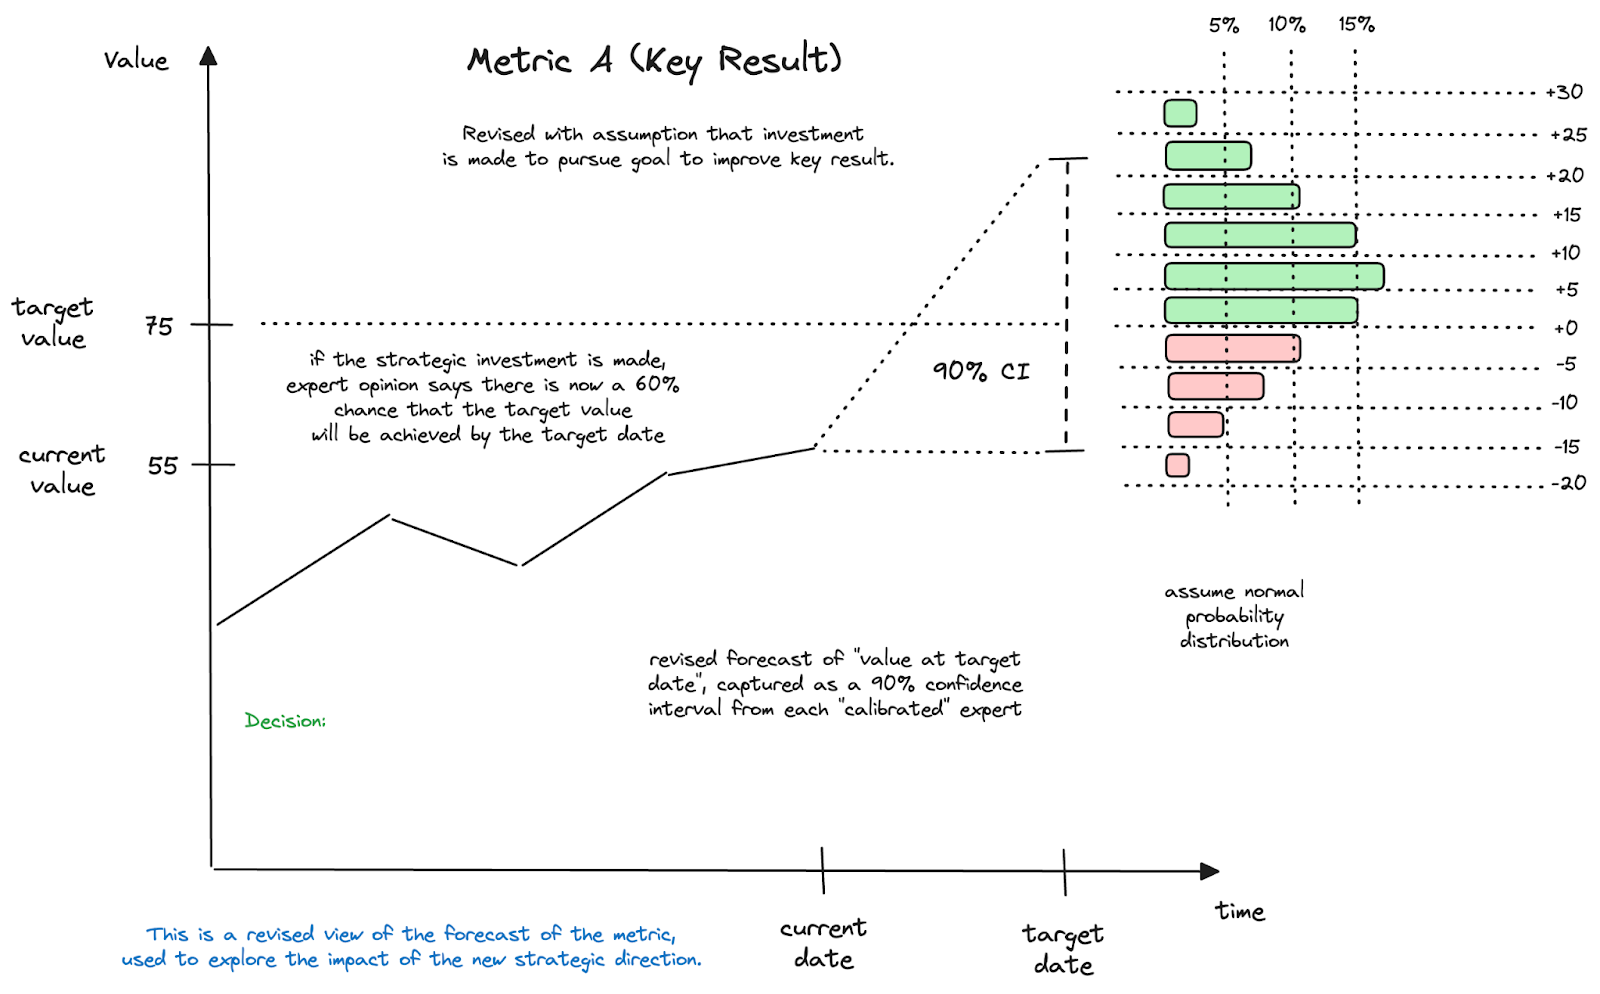
If the experts agree with the hypothesis, then the 90% CI position will likely shift (upwards here). That’s the whole point of investing, right? In this example, we’re seeing a shift that drives the probability of hitting the target from 10% to 60%. But, remember, driving change like this could also increase the width of the range (though that’s not shown here). That can occur because we are taking on more risk with the changes we’re driving than we’d have with the “do nothing” status quo case.
So there’s more green than red now. Senior leaders will like that.
Are we done?
Well, depending on the leadership team’s tolerance for risk, maybe there is enough green there to get the approval on the investment. But it’s also possible that they will want to remove more uncertainty before making the call. This is where it is crucial to weigh the value of more information with the costs of obtaining it. These situations have a severe case of diminishing returns, as Hubbard shows here:
So we might choose to remove some of that red by reducing the uncertainty with some fresh, juicy, high-value information.
In general, we can go “shopping” for relatively inexpensive information via activities like:
- Customer interviews
- Market research
- Tech research
- Prototyping
- Pilots
- Benchmarking
And, remember, a little bit goes a long way:
“When you know almost nothing, almost anything will tell you something.”
Douglas Hubbard
As the experts provide their revised forecasts, what factors do they cite when setting their upper and lower bounds? These questions can expose some areas in which you can “buy” some information, at a bargain price.
Not sure where to start down this new strategic path? Use these questions to drive interviews, research, or experimentation - those small bets that produce cheap insights and narrow that 90% CI range.
And then once you head down that path (with downstream projects, plans, low-level goals, and work items), updates on their progress qualify as new, valuable pieces of information, too!
Each completed step, each small bet that yields an insight, each delivered chunk of value that finds a consumer… these valuable bits of information reduce the uncertainty on the high-level desired outcomes.
The role of leadership is to surface this information, and translate it into revised confidence intervals for the metrics that matter the most.
And, for leaders, that feels like a fresh approach to the same old job.


.png)